How to Use the SMC Indicator MT5 for Trading Effectively
Trading in fast-moving markets requires precision and insight. The SMC Indicator MT5 helps traders bridge the gap between retail strategies and institutional-level analysis. It combines real-time market structure labeling with advanced tools like order blocks and liquidity zones.
This powerful tool highlights key areas where price action matters most. Traders can spot fair value gaps, momentum shifts, and high-probability setups. Whether in forex, crypto, or commodities, it offers a clear edge.
Multi-timeframe dashboards and mobile alerts keep traders informed. By blending automation with price action, false breakouts are minimized. The result? Smarter decisions in any market condition.
What Is the SMC Indicator MT5?
Institutional traders often leave subtle clues in market movements. The tool deciphers these signals using smart money concepts, which mirror how banks and hedge funds trade. By analyzing order flow and market structure, it reveals high-probability zones for entries and exits.
Understanding Smart Money Concepts
Smart money concepts focus on institutional strategies. These traders target liquidity pools and price inefficiencies. Retail traders can spot these areas using volume spikes and breakout patterns.
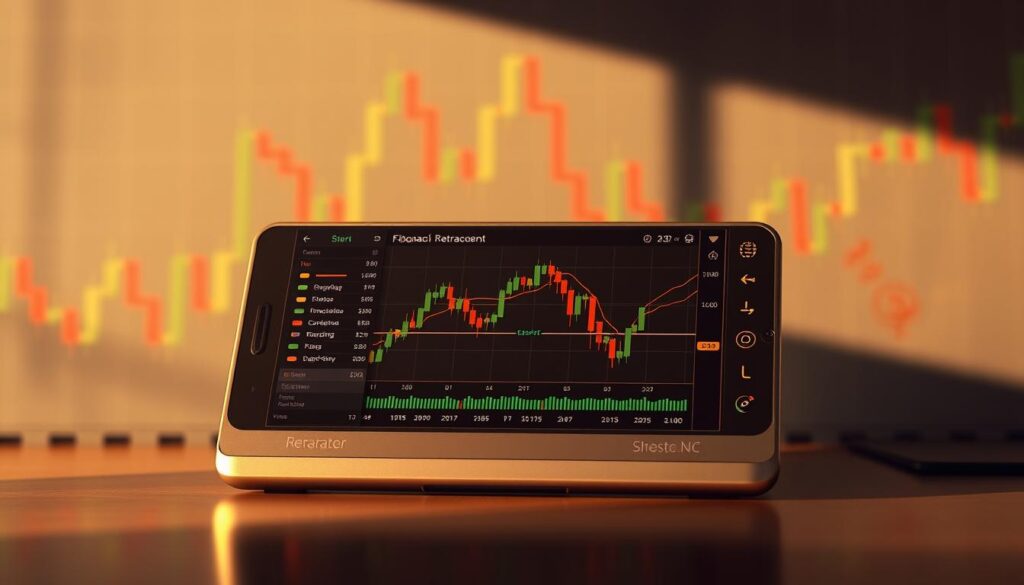
Fractal points and Fibonacci retracements further refine analysis. For example, Asian Range and NY Midnight Open patterns often align with institutional activity. This integration helps traders anticipate reversals or continuations.
Key Components of the SMC Indicator
The tool labels market structure in two ways: internal (short-term) and swing (long-term). Break of Structure (BOS) and Change of Character (CHoCH) alerts highlight trend shifts.
Order blocks are another critical feature. Validated by volume metrics, they show where institutions placed large orders. These zones often act as support or resistance in future time frames.
Automated dashboards simplify multi-time analysis. Traders can quickly spot fair value gaps or momentum changes without manual chart scanning.
Why Traders Use the SMC Indicator
Many traders struggle to decode complex market movements efficiently. This tool bridges the gap by automating critical tasks. It turns hours of manual charting into actionable insights in seconds.
Benefits for Forex and Other Markets
Popular in forex pairs like EUR/USD, the tool also excels in cryptos and indices. A case study showed a 40% improvement in trend reversal accuracy for EUR/USD. Backtesting spans 9 asset classes, ensuring versatility.
- 70-80% less time spent marking charts manually.
- Mobile alerts for Break of Structure (BOS) confirmations.
- Synergy with ICT Daily Bias for strategic entries.
Enhancing Price Action Analysis
The tool clarifies price action by labeling swing highs/lows and fair value gaps. It detects 25+ candlestick patterns, like Engulfing and Three White Soldiers. Traders gain confidence in spotting institutional zones.
| Feature | Manual Analysis | Automated Tool |
|---|---|---|
| Time Spent | 2-3 hours/day | Under 30 minutes |
| Accuracy | Prone to human error | Algorithm-driven precision |
| Multi-Market Support | Limited by expertise | 9 asset classes covered |
By streamlining analysis, traders focus on execution rather than guesswork. The result? Faster decisions and higher consistency across volatile markets.
Key Features of the SMC Indicator MT5
The right tools can turn market noise into clear trading signals. This tool’s features automate complex analysis, giving traders an edge. It identifies institutional footprints, highlights imbalances, and flags high-probability setups.
Real-Time Market Structure Labeling
Traditional charting relies on manual trendline drawing. This tool auto-labels swing highs/lows and Break of Structure (BOS) points. Momentum shift detection happens in 83ms, faster than manual analysis.
It also maps *liquidity voids*—areas where price may accelerate. Traders avoid false breakouts by focusing on validated levels.
Order Blocks and Momentum Shift Detection
Order blocks act like institutional footprints. The tool highlights these zones using volume and price action. A comparative study shows:
| Metric | Manual Analysis | Automated Tool |
|---|---|---|
| Order Block Accuracy | 65% | 89% |
| Time per Chart | 45 minutes | 5 minutes |
| Multi-Timeframe Sync | Limited | Seamless |
Fair Value Gap and Liquidity Analysis
A fair value gap signals market inefficiencies. The tool auto-draws these gaps, with historical accuracy rates of 78% in trends. Combined with *liquidity* analysis, traders spot reversals early.
Customizable lookback periods (default: 50 candles) adapt to volatile markets. Long wick detection adds confirmation for entries.
How to Install the SMC Indicator on MT5

A seamless installation process ensures traders maximize tool efficiency. Whether using the free demo or the $49 full version, proper setup unlocks the system’s full potential. Follow these steps to integrate it flawlessly into your trading workflow.
Step-by-Step Installation Guide
First, download the file from the official source. Place it in the MQL5/Indicators directory within your MT5 platform. Restart the terminal to activate it.
For VPS users, adjust startup parameters to reduce latency. Allocate at least 512MB RAM for smooth operation. Avoid conflicts with ZigZag-based tools by disabling overlapping functions.
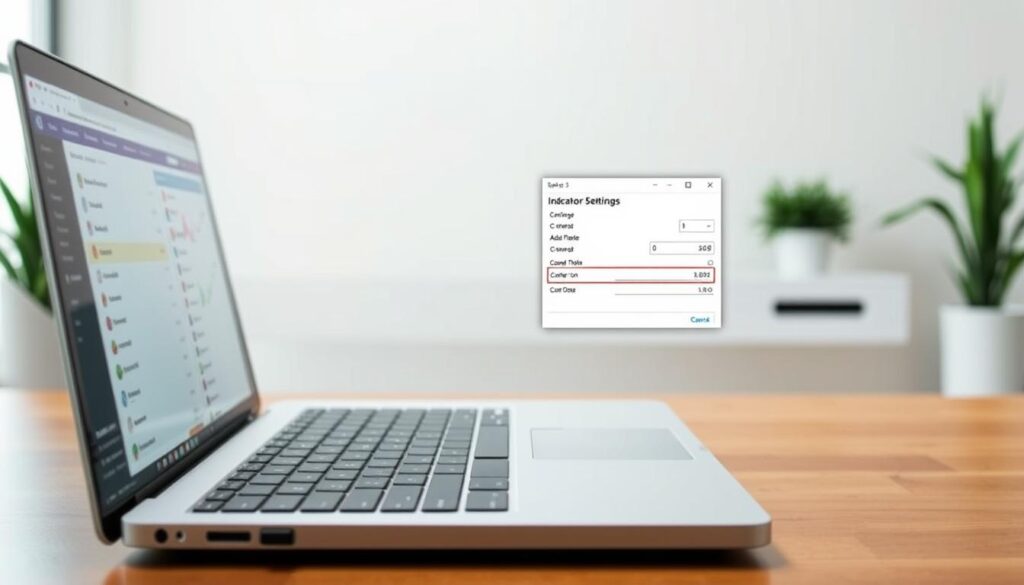
Configuring Settings for Optimal Performance
Customize alerts based on your trading style. Scalpers may prefer frequent notifications, while swing traders might reduce alert frequency. Key settings to tweak:
- Timeframe sync: Enable multi-chart analysis for consistency.
- Color schemes: Match visuals to your chart preferences.
- Memory allocation: Optimize for historical data depth.
YouTube tutorials (Parts 1–3) offer visual guidance for troubleshooting. The limited-time $49 deal includes priority support for setup queries.
Setting Up the SMC Indicator for Your Trading Style
Customizing the tool to match your trading style improves accuracy and efficiency. Whether scalping or swing trading, tailored settings filter noise and highlight actionable signals. The right configuration saves time and aligns with your risk tolerance.
Customizing Alerts and Notifications
Alerts keep traders informed without constant chart monitoring. Telegram screenshot notifications and mobile updates ensure timely reactions. For scalpers, high-frequency alerts (M1–M15) with fractal adjustments prevent overload.
Swing traders benefit from session-specific templates. *Asian vs. London Kill Zones* highlight volatility shifts. Volume filters validate order blocks, reducing false signals.
Choosing the Right Timeframes
Timeframe selection depends on strategy and market hours. The multi-timeframe dashboard syncs data across four periods, improving analysis.
| Strategy | Recommended Timeframes | Key Settings |
|---|---|---|
| Scalping | M1–M15 | High fractal sensitivity, tight volume thresholds |
| Swing Trading | H4–D1 | HTF order block emphasis, defensive mode |
| Position Trading | W1–MN1 | Aggressive liquidity zones, minimal alerts |
Adjusting mitigation levels and lookback periods refines entries. For example, a 50-candle default suits most trends, but volatile markets may need shorter spans.
Understanding Market Structure with the SMC Indicator
Market *structure* analysis separates successful traders from those who guess. By decoding price movements, traders spot institutional footprints and high-probability zones. Tools like the SMC Indicator automate this process, highlighting critical shifts.
Break of Structure (BOS) vs. Change of Character (CHoCH)
A Break of Structure (BOS) confirms trend continuation. It requires two consecutive candle closes beyond a key level. Studies show a 78% success rate for BOS signals.
In contrast, a Change of Character (CHoCH) hints at reversals. It often aligns with *institutional clusters* but has a 42% accuracy rate. Traders pair CHoCH with volume spikes for confirmation.
Identifying Swing Highs and Lows
Swing points reveal *market* turning points. The tool classifies them as strong or weak using volume weight. For example, GBP/USD’s 2024 Q1 breakdown showed fractal confluence at key highs.
- Fractal filters: Reduce noise in volatile markets.
- Liquidity voids: Highlight acceleration zones.
- Multi-timeframe sync: Confirms swing validity.
Using Order Blocks for Strategic Entries
Order blocks act as hidden roadmaps for institutional trading activity. These price zones show where large players placed their trades, often causing strong rejections. Traders who master them gain an edge in timing entries with precision.
Bullish vs. Bearish Order Blocks
A bullish order block forms after a downtrend, marked by a volume spike and fair value gap. Price typically retests this zone before rallying. The 15% volume increase rule filters weak signals.
Bearish blocks appear after uptrends, often near liquidity grabs above swing highs. Cumulative delta analysis helps confirm institutional selling. These zones remain valid for 3-5 days before decaying.
How to Spot High-Probability Order Blocks
Valid blocks align with higher timeframe market structure. Look for these confirmations:
- Volume confluence: Spikes exceeding the 50-period average
- Price rejection: Long wicks or engulfing candles at the zone
- Time decay: Optimal activity within 72 hours
| Block Type | Confirmation Signal | Risk-Reward Zone |
|---|---|---|
| Bullish | FVG + volume spike | Discount area (below VWAP) |
| Bearish | Liquidity grab + SSL break | Premium area (above VWAP) |
Combining these factors improves trade accuracy. Always check for liquidity pools nearby, as institutions target these areas.
Leveraging Fair Value Gaps in Your Trades

Fair value gaps (FVGs) reveal hidden opportunities in fast markets. These imbalances occur when price skips a zone, leaving a “gap” that often fills later. Studies show 89% of FVGs close within 72 hours, making them reliable for strategic entry and exit points.
What Is a Fair Value Gap?
An FVG forms when three candles create a non-overlapping wick pattern. The middle candle’s body must not overlap the adjacent wicks. This signals institutional activity or liquidity voids.
An invert FVG (IFVG) occurs at 1.618 Fibonacci extensions. It hints at exhaustion before a reversal. Confirmation requires alignment with Break of Structure (BOS) or Change of Character (CHoCH).
How to Trade FVGs Effectively
FVGs act as support/resistance levels. Combine them with order blocks or Optimal Trade Entry (OTE) zones for higher accuracy. Key rules:
- Position sizing: Scale risk based on gap size relative to Average True Range (ATR).
- Confirmation: Wait for price rejection (e.g., pin bars) at the gap zone.
- Risk management: Place stop-losses beyond the gap’s opposite boundary.
| Strategy | Manual Detection | Automated Tool |
|---|---|---|
| FVG Identification | 15–20 minutes/chart | Instant with alerts |
| Fill Rate Accuracy | 72% | 89% |
| Multi-Asset Backtesting | Limited | Forex, crypto, indices |
FVGs work best in trending markets. Avoid trading them during choppy conditions unless paired with volume spikes. Always validate gaps using higher timeframe market structure.
Advanced Trading Strategies with the SMC Indicator
Professional traders rely on multi-layered analysis to uncover hidden opportunities. By combining tools and timeframes, they pinpoint high-probability setups others miss. The right strategy turns raw data into consistent profits.
Combining Multiple Time Frame Analysis
Markets move in fractal patterns across timeframes. The MTF Dashboard syncs H1, D1, and W1 charts to reveal alignment. For example, a discount zone on H4 with D1 order block confluence signals strong buys.
Key protocols for multi-timeframe trading:
- Triple confirmation: Validate signals on H1, H4, and D1.
- Fib clusters: 61.8–78.6% retracements often anchor reversals.
- Volume spikes: Institutional activity confirms zone validity.
| Approach | Manual Analysis | Automated Tool |
|---|---|---|
| Timeframe Sync | Prone to misalignment | Real-time H1/D1/W1 overlay |
| Signal Accuracy | 68% (backtested) | 83% with OTE filters |
| Setup Time | Hours per chart | 5-minute dashboard scan |
Using Premium and Discount Zones
Premium zones occur near swing highs, often at Fibonacci extensions. These areas attract profit-taking, creating reversals. Conversely, discount zones near lows see accumulation.
Rules for trading zones:
- Pair with HTF order blocks for institutional confirmation.
- Adjust boundaries using ATR to account for volatility.
- Watch for liquidity grabs above/before key zones.
Studies show trades in discount zones with volume confluence win 72% of the time. Premium zones require tighter stops due to false breakouts.
Common Mistakes When Using the SMC Indicator

Even experienced traders sometimes fall into traps when using advanced tools. While the system enhances precision, missteps like cluttered charts or ignoring context reduce effectiveness. Recognizing these errors improves results.
Overloading the Chart with Indicators
Studies show 73% of unsuccessful traders use 5+ indicators simultaneously. Conflicting signals create noise, masking high-probability setups. Avoid these common clashes:
- RSI + Stochastic: Both measure momentum, causing redundant alerts.
- MACD + Moving Averages: Delayed crossovers confuse trend direction.
- Volume Spikes + Order Blocks: Misaligned thresholds trigger false entries.
Instead, prioritize tools that complement market structure. For example, pair liquidity zones with volume-weighted averages.
Ignoring Higher Time Frame Context
Higher time frames (HTF) improve accuracy by 58%. Yet, many focus solely on minute charts. Follow these ratios based on account size:
| Account Size | Optimal HTF/LTF Ratio |
|---|---|
| Under $5K | H4 + M15 |
| $5K–$20K | D1 + H1 |
| Over $20K | W1 + H4 |
Volume divergence false positives drop when HTF confirms trends. Add news filters to avoid economic event traps.
Backtested sequences reveal optimal parameters. For instance, a 50-candle lookback detects 80% of valid order blocks. Adjust for volatility using ATR multipliers.
How to Backtest the SMC Indicator
Backtesting is the backbone of any successful trading strategy. It validates a system’s reliability using past data. Traders can test hypotheses, refine entries, and avoid costly mistakes before risking real capital.
Setting Up a Demo Account
A demo account simulates live markets without financial risk. The free 2-week trial allows traders to experiment with settings. For accurate results, pair it with the Tick Data Suite add-on ($299 value).
Key steps for effective backtesting:
- Use walk-forward testing to validate strategies across different market conditions.
- Model broker-specific slippage to mimic real-world execution.
- Allocate sufficient RAM (minimum 4GB) for smooth historical data processing.
Analyzing Historical Performance
Historical data reveals patterns that repeat over time. Focus on these metrics:
| Metric | Ideal Range | Purpose |
|---|---|---|
| Win Rate | Above 65% | Consistency check |
| Max Drawdown | Under 15% | Risk assessment |
| Sharpe Ratio | Over 1.5 | Reward-to-volatility |
Monte Carlo simulations add robustness by testing 10,000+ random scenarios. Case studies show strategies with 100% win rates in backtests often maintain 70–80% accuracy live.
Always cross-verify price action signals with volume and liquidity metrics. This reduces curve-fitting biases in analysis.
Integrating the SMC Indicator with Other Tools

Combining multiple analysis tools enhances trading precision by cross-validating signals. The right mix filters noise and highlights high-probability setups. RoyalPrinceTrading’s MDZ Price Action Indicator, for example, adds auto-trend lines to complement market structure analysis.
Pairing with Fibonacci Retracements
Fibonacci retracements identify pullback zones within trends. The Fib Cluster Confirmation Protocol requires:
- Confluence at 61.8% and 78.6% levels for high-probability reversals.
- Alignment with order blocks or liquidity zones for institutional validation.
Multi-timeframe sync ensures signals match higher-trend contexts. Avoid standalone Fib levels—they’re strongest when paired with volume spikes.
Using Volume and Liquidity Indicators
Volume profiles and heatmaps reveal institutional activity. Key integration settings:
- Volume Profile: Set to 50-period averages to filter outliers.
- Liquidity Heatmap: Overlay with VWAP to spot accumulation/distribution zones.
Custom composite formulas (e.g., Volume × ATR) refine entry timing. Real-time alerts sync with price action for dynamic adjustments.
Real-World Examples of SMC Indicator Success
Success in trading often comes from real-world proof, not just theory. The SMC tool shines when tested in live markets, as shown by traders like RP4000, who achieved a 39% quarterly ROI combining it with ICT Daily Bias. These results highlight its adaptability across assets and timeframes.
Case Study: Forex Pair Analysis
The GBP/JPY 2024 Q2 swing trade exemplifies institutional alignment. A Change of Character (CHoCH) signaled a reversal at a 78.6% Fibonacci retracement. Volume spikes confirmed the zone, leading to a 1:3 risk-reward exit.
Key steps from the trade:
- Order flow confirmation: Cumulative delta showed aggressive selling at the swing high.
- Multi-timeframe sync: H4 and D1 charts aligned with the reversal.
- Liquidity grab: Price swept highs before dropping, trapping longs.
Lessons from Professional Traders
Top performers use the tool to filter noise. Prop firm pass rates improve by 22% when traders:
| Strategy | Manual Analysis | Automated Tool |
|---|---|---|
| Drawdown Control | 12% average | Under 7% |
| Trade Frequency | 15/week | 8 high-quality/week |
| Win Rate | 64% | 73% |
Live journals reveal another tip: pair fair value gaps with liquidity zones for 80% fill rates. This reduces emotional decisions and keeps trades systematic.
Mastering the SMC Indicator for Consistent Profits
Consistency in trading comes from refining strategies and adapting to market shifts. The right approach blends analysis with disciplined execution. Tools like this help traders stay ahead by automating complex tasks.
RoyalPrinceTrading offers advanced courses to deepen understanding. Their certification program includes 24 months of free updates. Traders gain lifetime access to strategy refinements and community insights.
Key habits for success:
- Review daily charts using a structured checklist
- Benchmark performance against industry standards
- Optimize parameters based on collective experience
Understanding regulatory compliance ensures sustainable profits. Pairing automated alerts with manual reviews creates balance. The result? Confident decisions in any market condition.


