Top Meta Trader Indicators for Forex Trading Success
Warren Buffett once said, “The stock market is designed to transfer money from the Active to the Patient.” This shows how important it is to use the right tools and strategies for trading success. In Forex trading, knowing the best meta trader indicators helps a lot.
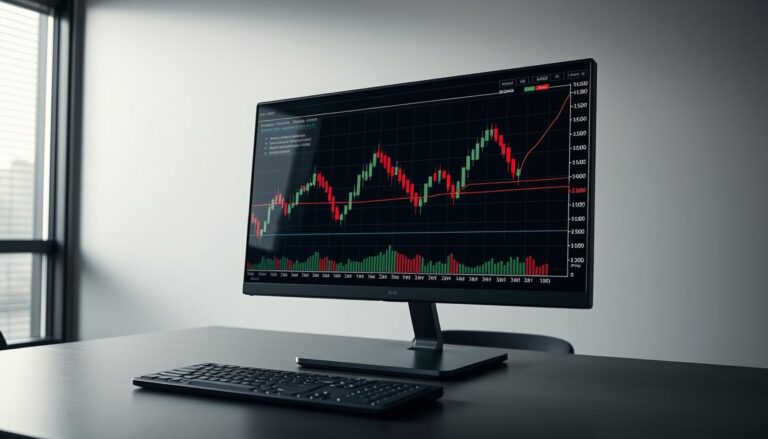
MetaTrader 4 (MT4) and MetaTrader 5 (MT5) are top platforms. They have features that help traders deal with the Forex market’s complexity. The best meta trader indicators from these platforms are key in predicting market moves and analyzing price trends. They help traders make better decisions and boost their trading success.
There are many options, from Moving Averages to the Relative Strength Index (RSI). This lets traders customize their strategies to fit their needs. As Forex trading changes, using reliable indicators is key for success in this competitive field.
Understanding MetaTrader 4 and MetaTrader 5
MetaTrader 4 (MT4) and MetaTrader 5 (MT5) are big names in the Forex market. MT4 came out in 2005 and is loved for its easy-to-use interface and trustworthiness. It’s a top pick for retail traders. It has key meta trader 4 indicators that help traders understand price changes and improve their trading plans.
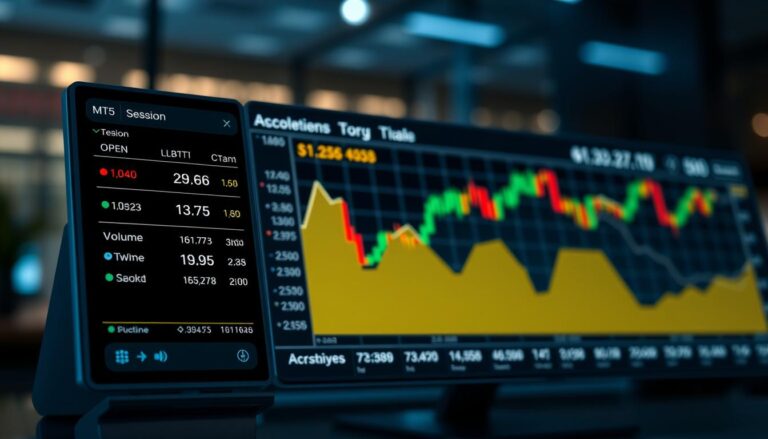
MetaTrader 5, or MT5, was launched in 2010 as MT4’s successor. It has more features for trading different assets like stocks and commodities, not just forex. MT5 has more indicators and tools than MT4, making it great for experienced traders who need a full trading toolkit.
Both platforms work well with popular browsers and operating systems, giving users a smooth experience. MT4 is still a favorite for many because of its huge number of third-party plugins and learning resources. These resources cover everything from using the platform to making expert advisers. MT5 also has learning resources, but they might not be as wide-ranging as MT4’s.
When traders look at these platforms, they’ll see they’re not the same. MT5 offers 21 time frames for deeper analysis, while MT4 has 9. MT5 also has better security with two-factor authentication, which makes traders feel safer. Knowing what each platform offers helps traders pick the one that fits their trading style and goals best.
Key Types of Meta Trader Indicators

Meta Trader indicators are key for helping traders make better choices. They come in four main types: trend indicators, oscillators, volume indicators, and custom tools. Knowing these types can make trading strategies more effective.
Trend Indicators like Moving Averages and the Parabolic SAR help spot market trends. The Simple Moving Average (SMA) with a 14-day setting is a top choice. Shorter periods, like 5 days, can give clearer signals.
Traders often buy when prices go above the Moving Average and sell when they go below. This method can lead to big wins, with some traders making up to 205 pips.
Oscillators show market momentum and when trends might change. Tools like the Relative Strength Index (RSI) and the Stochastic Oscillator are key. They help traders see if assets are too high or too low, guiding their decisions.
Volume Indicators show how strong price moves are. Indicators like On-Balance Volume (OBV) and Average True Range (ATR) are important. They help traders understand price stability and trend strength.
Custom Tools let traders tailor their indicators to their needs. This means they can make tools that fit their trading style perfectly.
Learning about these main types of Meta Trader indicators helps traders use the platform fully. It’s crucial for making good trading strategies. By picking the right tools, traders can move through the forex market with more confidence and accuracy.
Best Meta Trader Indicators for Trend Analysis

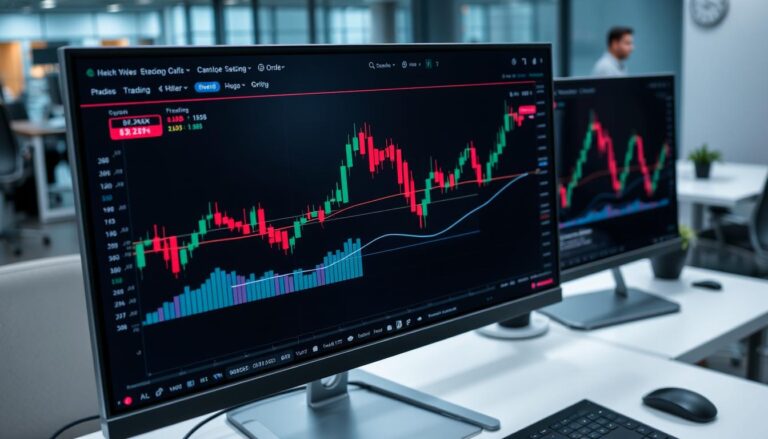
Trend analysis is key in Forex trading success. The best meta trader indicators give traders important insights. They help make smart choices. Moving Averages, Bollinger Bands, and the Parabolic SAR are top picks for spotting trends and reversals.
Moving Averages
Moving Averages smooth out price data, showing trends clearly. They average past prices over time. This helps traders see if an asset is going up or down.
There are two main types: Simple Moving Average (SMA) and Exponential Moving Average (EMA). Each reacts differently to market changes. A download of meta trader indicators often includes many moving averages for customization.
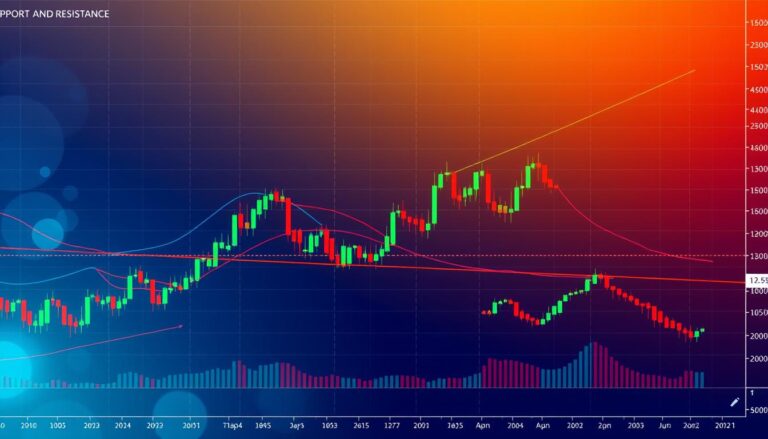
Bollinger Bands
Bollinger Bands are great for trend analysis too. They have a moving average and two standard deviation lines. These lines show how volatile the market is.
When prices go beyond the bands, it might mean a breakout. Traders use Bollinger Bands with other indicators for better market predictions. They’re among the top indicators for spotting trends and reversals.
Parabolic SAR
The Parabolic SAR indicator spots possible trend reversals. It shows points above or below the price chart. This tells traders when to exit or enter trades.
This helps in setting stop-loss orders, managing risks in Forex trading. For trend-following, the Parabolic SAR is a must-have. You can find it in many meta trader indicators downloads.
Popular Oscillator Indicators for Forex Trading

Oscillator indicators are key in spotting market trends and momentum. Traders use them to make smart choices in the fast forex market. This section looks at two top oscillator indicators: the Relative Strength Index (RSI) and the Stochastic Oscillator. These indicators help traders find the best times to buy and sell.
Relative Strength Index (RSI)
The Relative Strength Index (RSI) checks how fast and how much prices are moving. It ranges from 0 to 100. A reading over 70 means the market is too high, and under 30 means it’s too low. This helps spot when trends might change, making it a top choice for traders.
Stochastic Oscillator
The Stochastic Oscillator looks at how a currency’s closing price fits into its past price range. It’s great for day trading with its 5.3.3 settings. You can tweak it to 8.3.3 or 14.3.3 for more action on busy charts. It shows when the market is too high or too low, helping traders know when to act.
Using the Stochastic Oscillator with other tools makes decisions better. It works well with many trading plans, from quick trades to longer ones.
| Indicator | Scale | Overbought Level | Oversold Level | Default Settings |
|---|---|---|---|---|
| Relative Strength Index (RSI) | 0 – 100 | Above 70 | Below 30 | N/A |
| Stochastic Oscillator | 0 – 100 | Above 80 | Below 20 | 5.3.3 |
Volume Indicators and Their Importance
In Forex trading, volume indicators are key for understanding market dynamics. They show buying and selling pressures in currency pairs. This helps traders spot market trends. High volume means strong buying, which could mean a good time to buy. Low volume might mean selling, which could be a good time to sell.
Indicators like On-Balance Volume (OBV) and Average True Range (ATR) are vital for trading strategies. They help traders make better decisions.
On-Balance Volume (OBV)
The On-Balance Volume (OBV) indicator is key for understanding price movements through volume. It adds or subtracts volume based on daily closing prices. This gives traders clues about market direction.
A rising OBV means more buying, which could mean the trend will keep going. A falling OBV means selling, which could mean a trend change. OBV is a top choice for Forex traders because of its usefulness.
Average True Range (ATR)
The Average True Range (ATR) is another important tool. It measures market volatility. This helps traders set risk levels and decide how big to make their trades.
A higher ATR means more market ups and downs. This can be both good and bad. With volume indicators, ATR helps traders make better choices. This can lead to more success in trading.